

Importing time-based log data
Related video: Importing and working with .csv files (1:53)
Related video: Time based data (7:25)
The LAS 2.0 Standard is very strict about only allowing numeric values below the ~A line. So it requires date and time values to be in ISO 8601 standard format (actually, a subset of that standard). The relevant section is 5.9 “Date and Time Curves in the Data (~A) section”. (By the way, you can access the LAS 2.0 Standard document in PDF format at any time from the Help menu).
So, dates must be formatted as either of
And times as one of
Time based LAS files are first class citizens in LAS Explorer; you can format and plot them just as you would depth-based files. Plus there is some extra support for working with files that are not in the accepted ISO 8601 format, helping you get them there without too much wasted time and fuss.
Let’s look at an example of a fairly thorny .csv file which contains curves that are keyed on a date and time, that we’d like to import into an LAS file (this particular file comes from Australia). As will often be the case, the date and time curves are going to need some help. Let's se how quickly can we get these cleaned up in LAS Explorer.
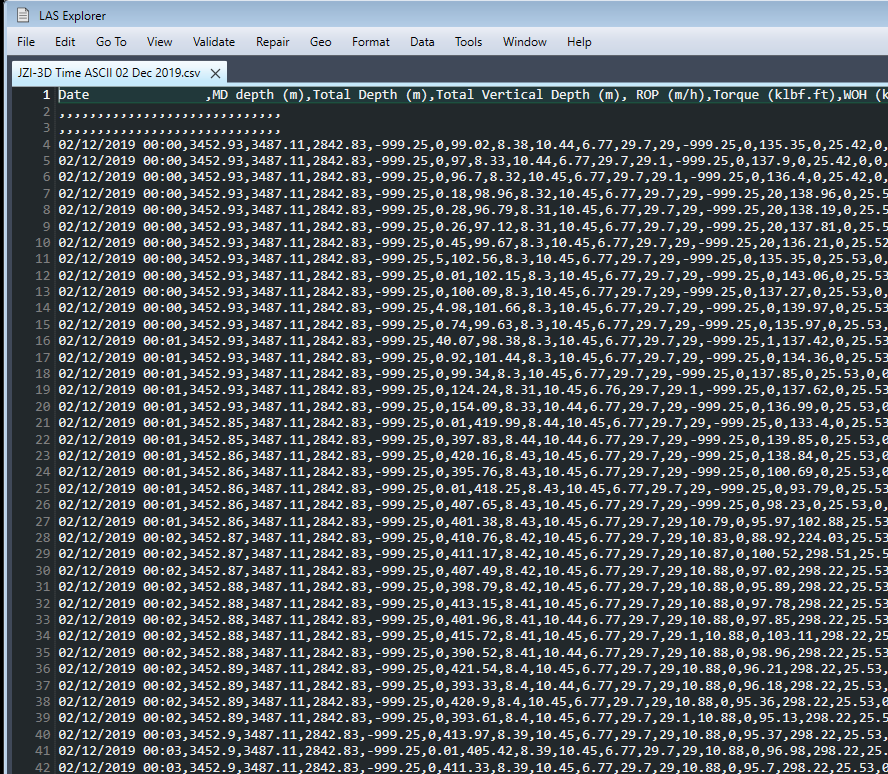
So the date and time are together in one column, separated by a space. Here’s what we need to do:
Of course there may be other issues we need to deal with. This file has a couple of lines with just commas and no data, obviously we will want to filter those out.
With this file open in the LAS Explorer editor, we can go to the File menu and select the option to create a new LAS file from this file, using the import wizard (this menu option is a convenience when you have a .csv file open, it just saves you a few mouse clicks, as you don't have to open the import wizard and then from there go find the file in Windows File Explorer).
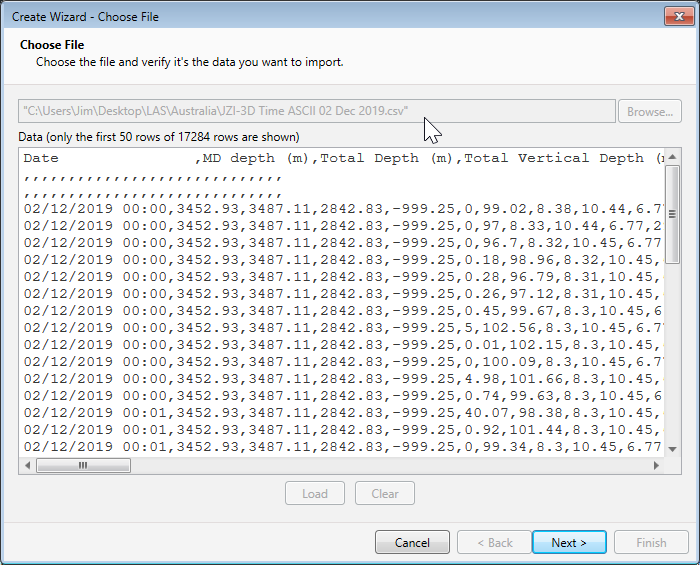
This is the "Choose File" page of the import wizard, of course our file is already chosen and the data looks as expected, so let’s click on ‘Next’.
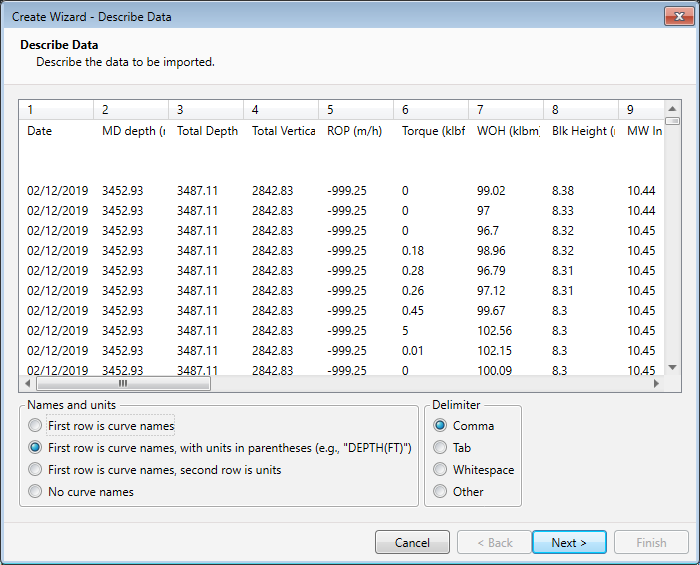
This looks good. We still see the two lines with no data (minus the commas now). The wizard will just drop them, which is what we want. And the wizard has guessed correctly on the delimiter, and sees that the first line is a header line, and that each header is the curve name followed by the curve units in parentheses. Let’s click on ‘Next’.
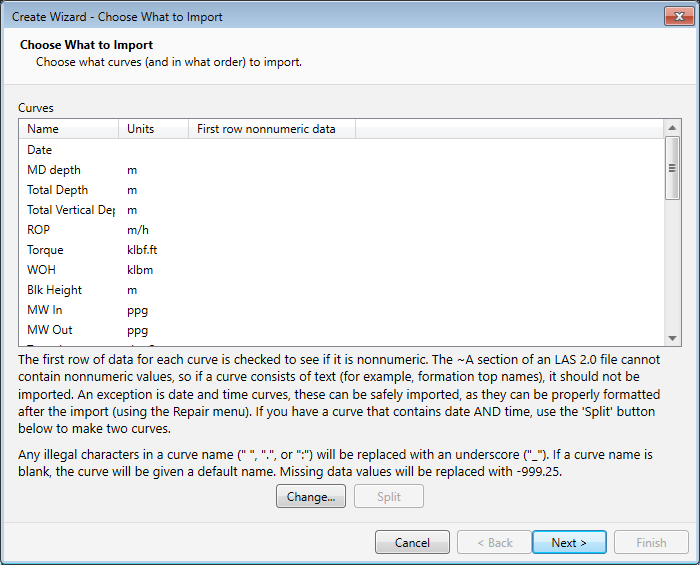
This screen lets us choose what curves to import, and warns us about non-numeric data that would be a problem. It is also our chance to split the one first curve into two separate curves, one for date values and one for time values. To do that, we just need to highlight the ‘Date’ curve in the grid, and click on ‘Split’.
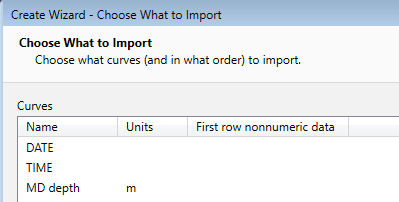
Let’s click on ‘Next’, accept the default on the last page, and click 'Finish' to exit the wizard.
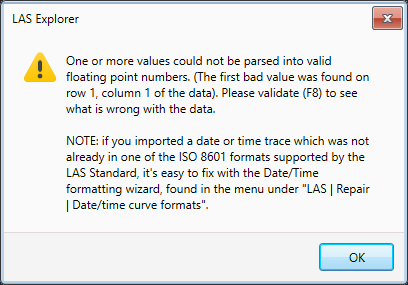
That’s a helpful message, as it tells us exactly what we need to do to finish the process. After we click 'OK', let’s scroll down to the ~A section and see how we’re doing.
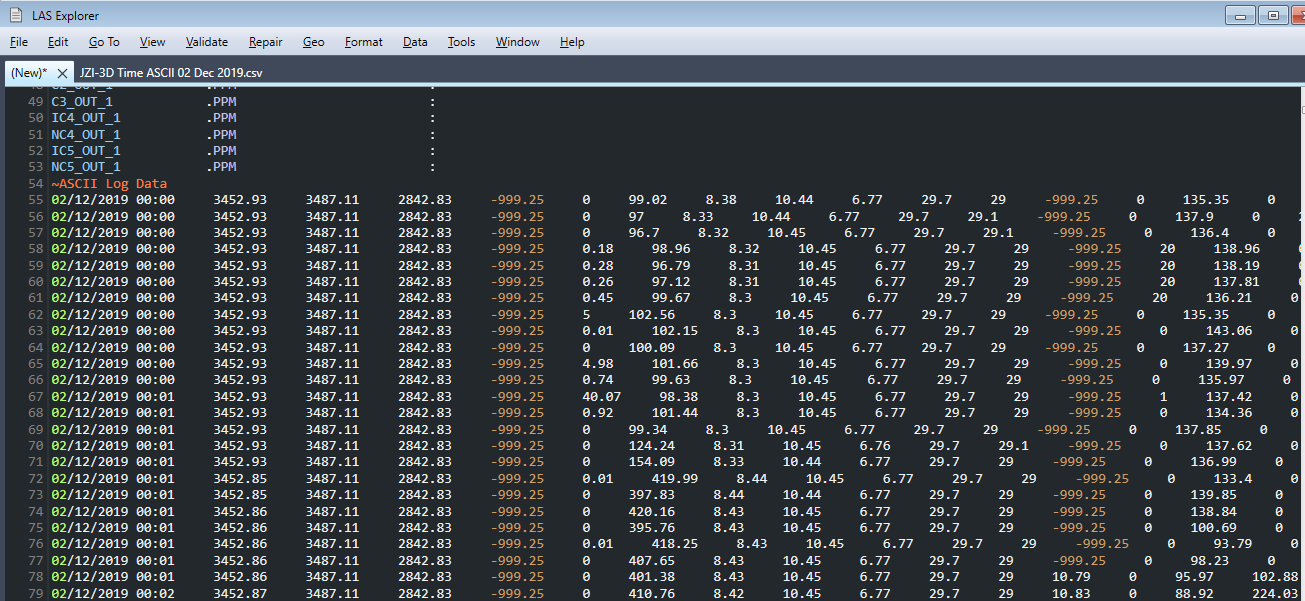
Now let’s finish the job. From the Repair menu, we’ll select “Date/time curve formats”.
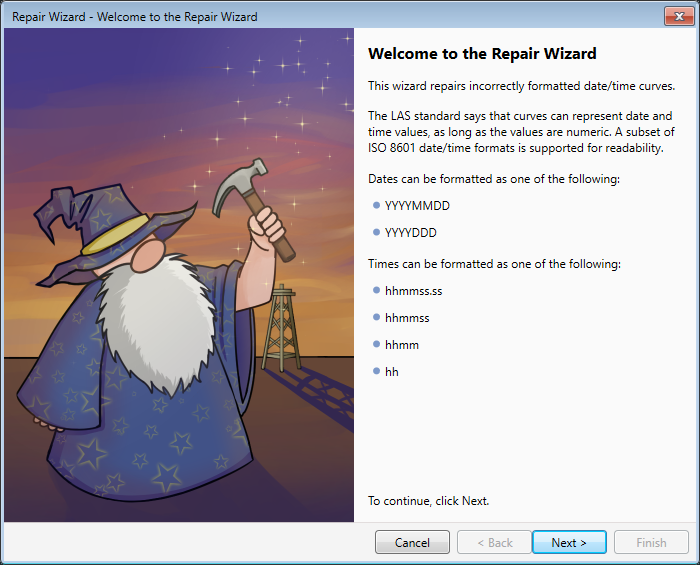
The first page of the date/time repair wizard is informative, it reminds us of what ISO 8601 formats we will need to get our date and time values to. We click 'Next', and on the next page, we tell the wizard which curve is the date, and which one is the time. Clicking 'Next' again takes us to the Select Culture page.
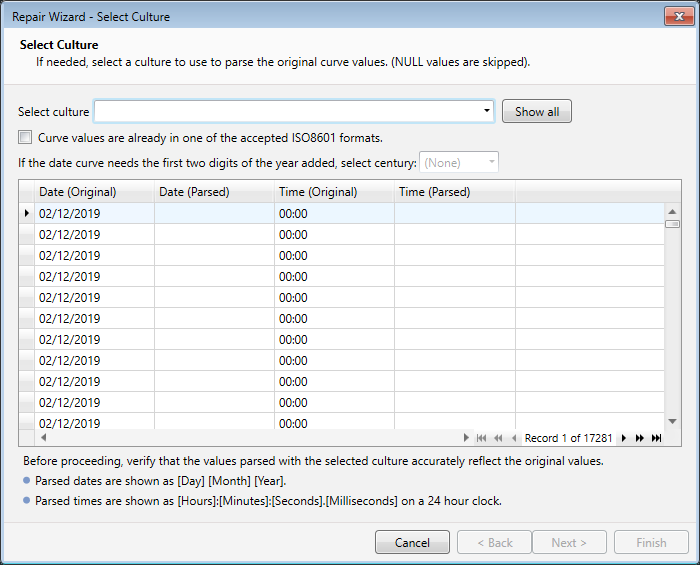
Here things feel like they’re getting complicated, but that’s only because the wizard has to be tolerant of virtually any date or time format that it might be asked to convert. It just needs a little help with knowing what format to use. In the dropdown labelled “Culture”, by default you can choose the invariant culture, or US or Canadian English. Usually one of these will be what you want, but if not, you can expand the list to include all cultures. We’ll try the invariant culture.
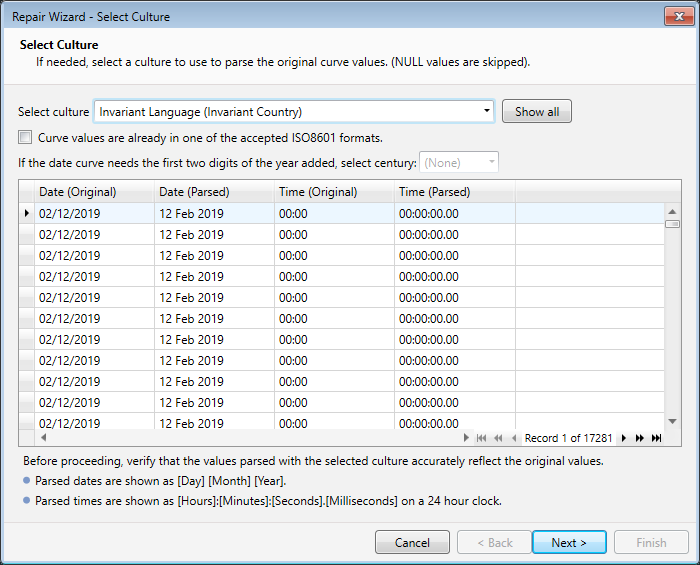
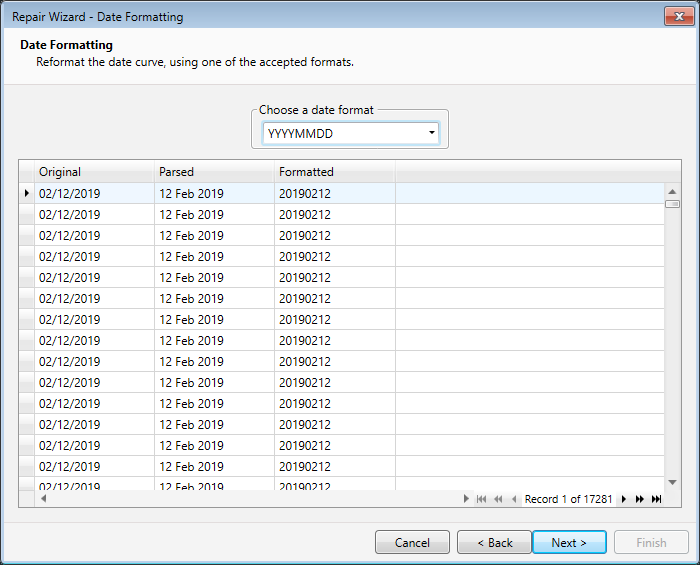
Every time you choose a culture, the wizard interprets the date and time values according to that culture. You can scroll through the grid to see if the parsed values are as expected. In our case they are, so we click ‘Next’. In the next two screens, we just choose which of the allowed ISO 8601 formats we want for the date curve, and which for the time curve.
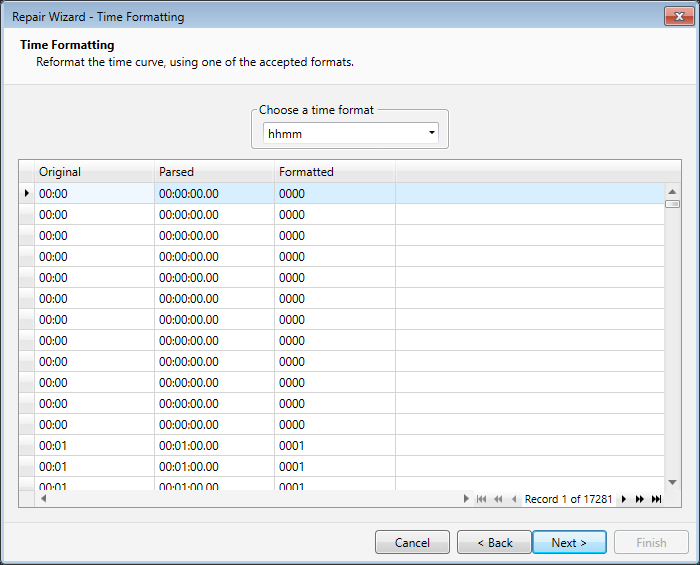
Note that we chose “hhmm” for time, because the time value precision is in minutes, so there’s no reason to use a longer format that includes seconds. Let’s click on ‘Next’, accept the default on the last page, and click 'Finish' to exit the wizard.
Now let’s use the Quick Plots feature (in the Data menu, or else just press Shift + F7), the program should detect that the file is time based (i.e. it has DATE and TIME curves now) and default the Y axis accordingly.
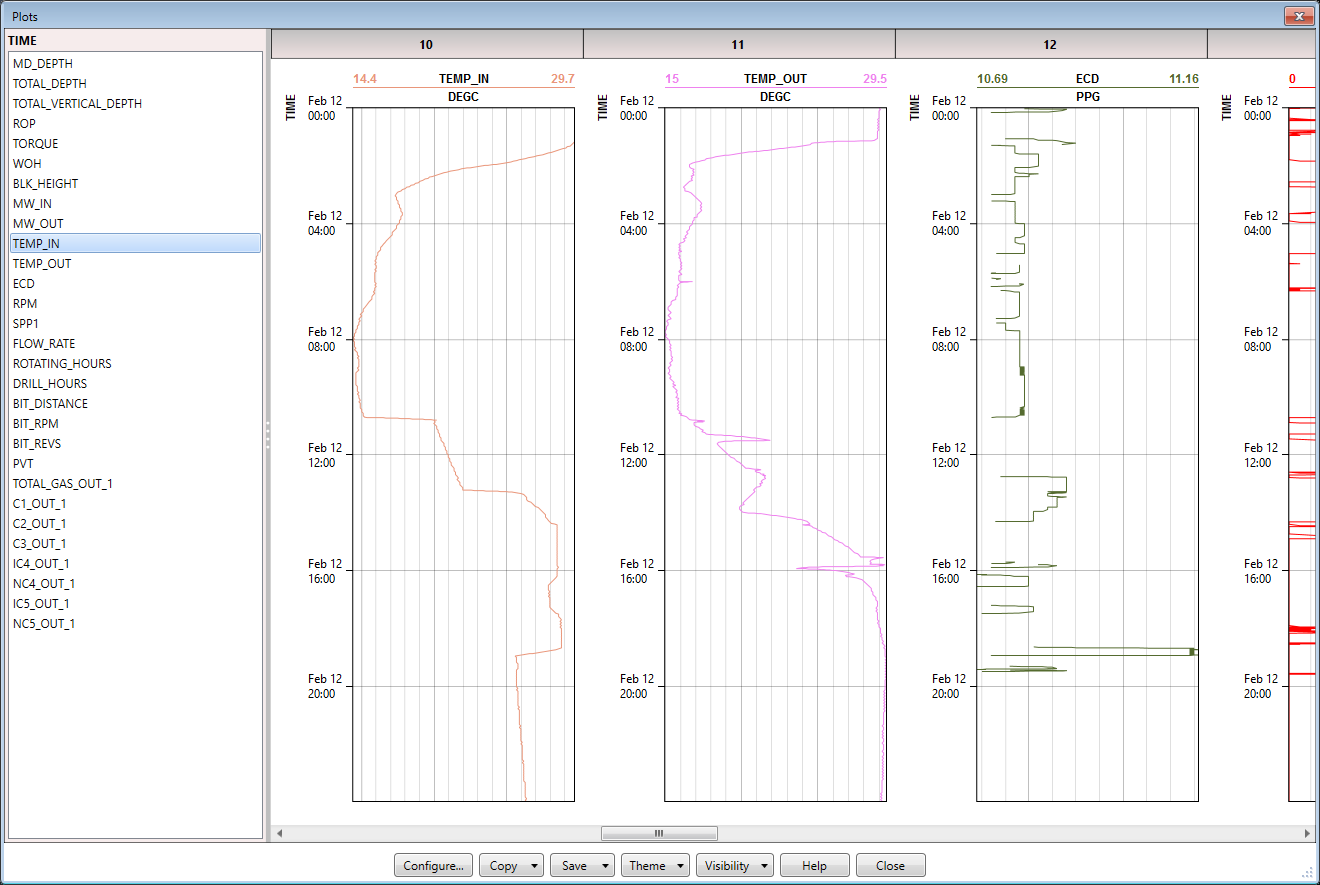
That looks awesome. And the entire process took less than ten minutes.
If you have a file with date/time curves that you have trouble importing, please send it to us, perhaps we can improve the program further to accommodate it.
Back to blog index