
Exporting LAS files to Excel
Related video: Exporting data (2:17)
Microsoft Excel: used by billions, loved by millions. Of software that deals with data (and any program that works with LAS files falls into that category), I'm often fond of saying “There is no such thing as too much integration with Excel”.
If you have tabular data in Excel, creating an LAS file from it is pretty straightforward. Just select the range of data in Excel, and copy it to the clipboard. Be sure and include the header row (if there is one). Then, in LAS Explorer, just create a new file (File | New in the menu, or press Ctrl+N) to launch the wizard. Select ‘Clipboard’ as the source, and follow the remaining steps, which are quick and simple. Presto, you have an LAS file. Of course, the header will be pretty empty, hopefully you can supply values for key mnemonics, like WELL, COMP, FLD, etc. Presumably you know what those are. It’s all pretty straightforward, and quick.
Exporting is also easy, but it’s worth taking note of some extra support the export wizard in LAS Explorer has for Excel. Because, you know, there is no such thing as too much integration with Excel.
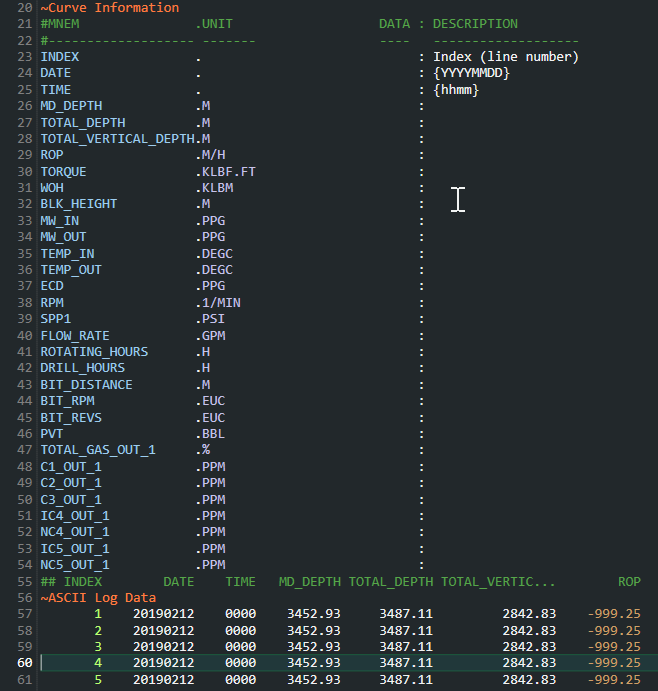
Let’s take the file we created in Importing time-based log data, this file covers a 24-hour period, and we know that programs that work with LAS files don’t always support time-based files as well as depth-based. But in LAS Explorer time-based files are first class citizens. So this is a great choice for our demo for exporting to Excel.

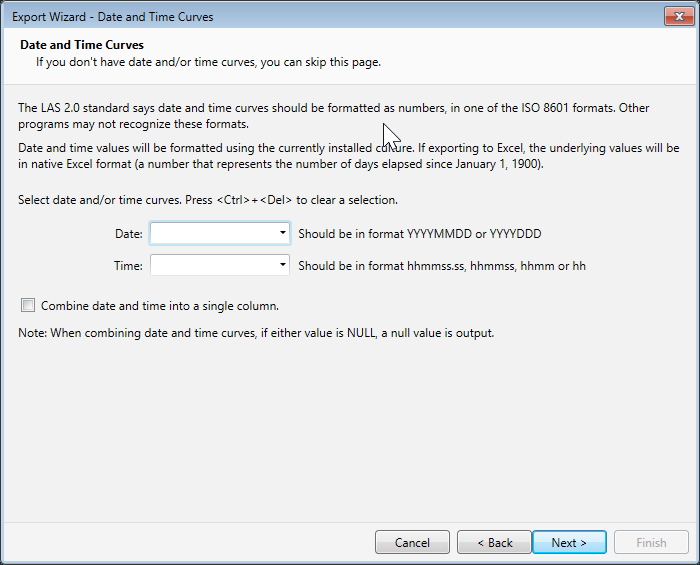
We can launch the export wizard with F9 or by selecting Export from the File menu. Once it's open, let’s click through until we get to the page about date and time curves.

We had to do some work when bringing this data into LAS from a CSV file, converting dates and time to the accepted ISO 8601 formats. But Excel would just see those values as numbers; we need to convert back to some standard date format when exporting to Excel. The export wizard takes care of this for us. We also have the option here to recombine them back into a single column, which is really convenient. In this example, we’ll leave that unchecked to output separate date and time columns in Excel.
Let’s select the date and time curves and go to the next page, where we have some options for exporting header sections. Though the format of data in an LAS header doesn’t really lend itself to the tabular structure in Excel, sometimes it's convenient to bring along the text of one or more header sections.
The next page is very interesting. Let’s say our NULL value in our LAS file is -999.25. Curve data points with that value will always be recognized as such by LAS Explorer (and likely any other program you use that understands LAS files), but of course that number has no special meaning for Excel. So this page gives us the option of leaving those cells blank. If you do want to export the -999.25 values, there’s a nice option to create a formatting rule in Excel so they appear red, making them stand out when you visually scan the data in Excel.
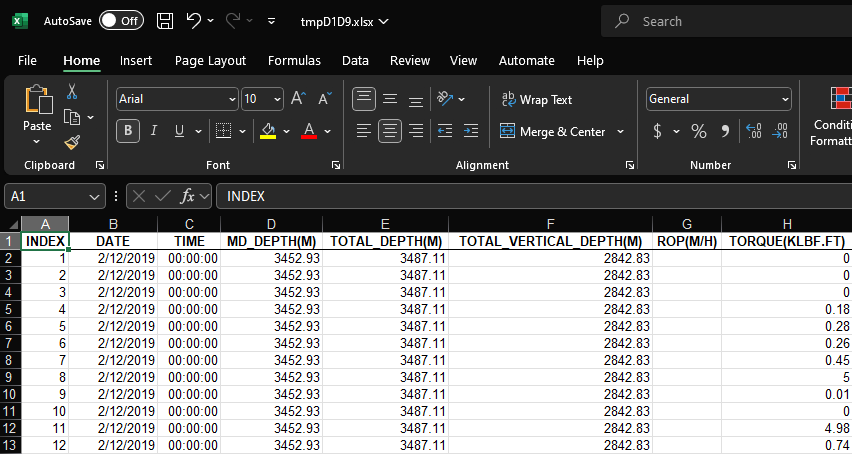
So now let's look at the output in Excel.

The initial ROP values in this file, which were null (-999.25), are left blank. Date, time, and numeric columns are formatted as such and right aligned. Note the complete lack of cell badge icons from Excel warning you that you have strings that look like numbers.
That was fast, and easy.
If you have an idea for improving the integration with Microsoft Excel, let us know, we’d like to hear about it.
Back to blog index